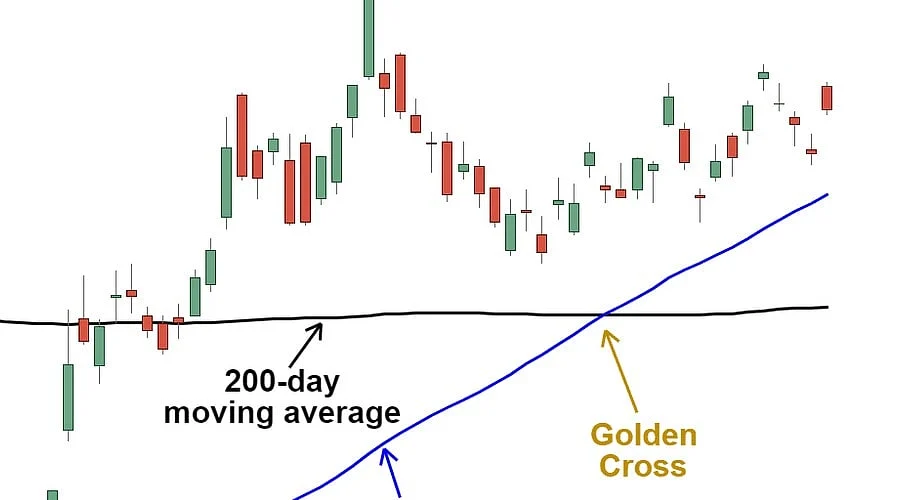
Golden crossover signals rank among the most widely used technical indicators within the crypto trading space. They materialize when a short-term moving average crosses over a long-term moving average, signaling that recent price momentum has grown stronger compared to the broader trend. Market participants monitor these closely for Bitcoin as well as other digital assets, though the appearance of a signal does not guarantee sustained price increases.
How Does a Golden Cross Work?
A classic golden cross takes place when the 50-day moving average moves above the 200-day moving average. Moving averages serve to smooth out price data. A 50-day exponential moving average places greater emphasis on recent closing prices over a span of 50 days, while a 200-day EMA does the same across a 200-day timeframe.
Binance Academy notes that this pattern typically unfolds across three phases. In the first phase, the shorter moving average stays beneath the longer moving average during a downtrend. In the second phase, improving prices drive the short-term average past the long-term average. In the final phase, traders observe whether the shorter average manages to maintain its position above the longer one as the uptrend establishes itself.
The opposite occurrence is known as a death cross, which happens when the shorter moving average drops below the longer one and is generally viewed as a bearish signal.
Bitcoin Provides a Useful Example
Bitcoin formed a notable golden cross during late October 2023, at which point the cryptocurrency traded near USD 35,000. By March 2024, Bitcoin’s price climbed past USD 73,000, marking a gain exceeding 100%. This upward move also aligned with the January 2024 greenlight given to US spot Bitcoin ETFs.
This case illustrates why market participants should refrain from crediting an entire price rally to a single chart pattern. ETF demand, market liquidity, broader macroeconomic conditions, and general investor sentiment can all drive prices alongside technical indicators.
SMA vs EMA Golden Cross
Traders can construct golden crosses using either simple moving averages or exponential moving averages. An SMA assigns equal weight to every price point within a chosen period. An EMA prioritizes recent prices, enabling it to react more quickly. Quicker reactions allow for earlier identification of momentum shifts, but they can also produce extra false signals within volatile cryptocurrency markets.
How Traders Confirm the Signal
According to Binance Academy, some traders examine trading volume surrounding a crossover because higher volume can offer extra confirmation. Tools such as the Relative Strength Index and the Moving Average Convergence Divergence can also prove helpful in establishing broader context.
Generally, higher time-frame crosses—such as those on daily or weekly charts—receive more weight from traders than lower time-frame crossovers found on hourly or four-hour charts.
Despite their significance, golden crosses function as lagging indicators because moving average calculations rely on historical prices. Consequently, cryptocurrencies may experience substantial gains before the cross actually materializes.
Final Thoughts
A golden cross assists traders in spotting a potential transition toward bullish momentum. The combination of the 50-day and 200-day moving averages remains the most frequent setup. Nonetheless, market participants should take trading volume, current market conditions, and additional indicators into account, given that false crossovers can take place.
Also Read: UK Crypto Firms Must Seek FCA Approval Under New Regulatory Rules
FAQs:
1. What is a golden cross in crypto trading?
A golden cross takes place when a shorter-term moving average crosses above a longer-term moving average. Observers generally view this pattern as a potential sign that bullish momentum is gaining strength.
2. Which moving averages are commonly used for a golden cross?
The most frequently followed configuration is the 50-day moving average crossing above the 200-day moving average. Depending on their trading approach and timeframe, individuals can also apply other periods.
3. Is a golden cross always a bullish signal?
While typically regarded as bullish, a golden cross does not ensure that cryptocurrency prices will keep climbing. False crossovers can happen, especially in volatile or sideways markets.
4. What is the difference between a golden cross and a death cross?
A golden cross develops when the shorter moving average rises above the longer one. Conversely, a death cross occurs when the shorter moving average drops below the longer-term average.
5. How can traders confirm a golden cross?
Traders may look at trading volume, the RSI, the MACD, and prevailing price trends alongside the crossover. Incorporating extra indicators supplies helpful context to differentiate robust momentum from a potential false signal.