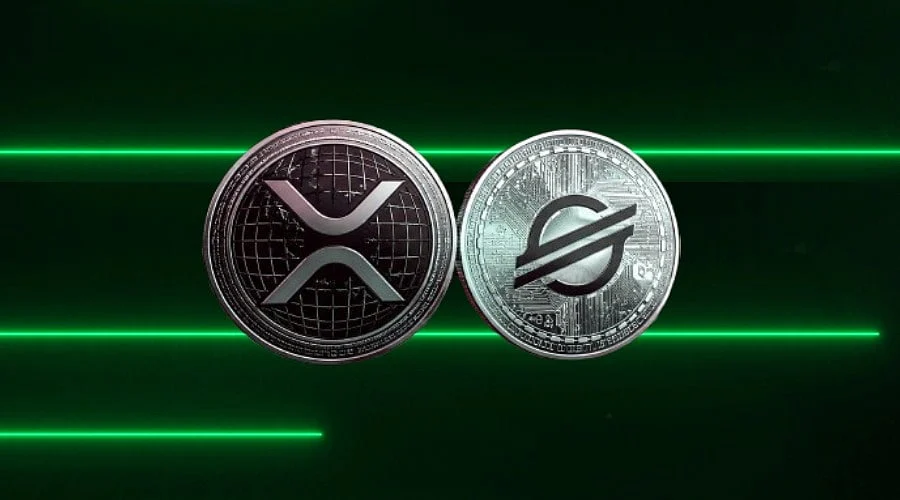
Tuesday saw XRP and Stellar’s XLM stay under pressure as market participants dealt with softer momentum, cautious derivatives positioning, and significant resistance barriers. Concurrently, Stellar achieved a peak of 217.4 transactions per second, backing USD 3.38 billion in tokenized assets. This milestone reinforced the network’s standing in real-world asset tokenization while XRP and XLM found it difficult to maintain their recent advances.
Stellar has evolved into the third-largest blockchain for tokenized real-world assets, based on provided reports. Its assets under management currently surpass those found on Avalanche, Solana, and Aptos.
Even so, overall market conditions stay mixed. A recent security breach involving compromised D’CENT wallet keys resulted in more than USD 18 million worth of XRP losses, alongside an impact on assets hosted on Stellar.
Stellar Growth Contrasts with Weak XLM Derivatives
Stellar’s network expansion coincides with an upswing in institutional engagement regarding tokenized assets. Its USD 3.38 billion tally in tokenized assets positions the blockchain among the top networks supporting real-world assets.
At the same time, XLM trades around USD 0.224 following a rejection near USD 0.234. The digital asset holds above its primary moving averages, with the 100-day, 50-day, and 200-day EMAs positioned roughly between USD 0.187 and USD 0.193.
Derivatives traders, however, maintain a cautious outlook. Figures from CoinGlass indicate that XLM’s long-to-short ratio registered at 0.76 on Tuesday, coming close to its weakest point in over a month. A ratio falling under one signifies that short positions outnumber long positions.
The funding rate for XLM stays positive at 0.0083% after shifting positive on September 14. A positive funding rate indicates that long traders compensate short traders, pointing to ongoing interest in bullish exposure.
Data sourced from CryptoQuant highlights a more cautious perspective. Spot markets for XLM display sizeable whale orders, whereas futures markets reflect sell-side dominance and overheated conditions.
This dynamic introduces a central question for market participants: Can robust activity on the Stellar network counterbalance the weakening derivatives indicators observed for XLM?
XRP Holds Above Major Moving Averages
XRP changes hands near USD 1.469 following three consecutive negative sessions. Although the token has pulled back below USD 1.480, its broader technical framework remains situated above critical moving averages. The 50-day EMA rests at USD 1.365, whereas the 200-day EMA is positioned at USD 1.369. Additional support reference is provided by the 100-day EMA near USD 1.307.
During this retracement, momentum has cooled. The Relative Strength Index for XRP declined toward 53, bringing it close to neutral ground. Simultaneously, the MACD indicator has flattened near zero.
Derivatives positioning also presents a mixed picture. CoinGlass data places XRP’s long-to-short ratio at 1.02 on Tuesday. A metric above one indicates that long positions marginally outpace short positions. The funding rate for XRP likewise remains positive, having turned positive on September 24 and registering at 0.0020% on Tuesday.
Nonetheless, CryptoQuant metrics point to overheating across XRP spot and futures markets. Futures activity likewise displays sell-side dominance, introducing an element of caution to the prevailing setup.
Also Read: Bitcoin Holds Near USD 83,000 as Zcash Slides 12%
Key XRP and XLM Levels Come Into Focus
Regarding XRP, the primary support region is located near the 200-day and 50-day EMAs between USD 1.365 and USD 1.369. Moving past that zone directs attention toward USD 1.307 and USD 1.300. A more severe drop could expose the psychological threshold of USD 1.000. Conversely, upside resistance for XRP is encountered near USD 1.574, and a breakthrough past that barrier could draw attention to the USD 1.900 resistance band.
XLM confronts immediate resistance close to USD 0.234. Surpassing that threshold would reinforce the existing upward trajectory. Initial downside support originates from the cluster of moving averages, with the 200-day EMA resting near USD 0.190 and the 50-day EMA centered around USD 0.192.
Proximity to the 100-day EMA follows near USD 0.187, alongside former trendline support sitting around USD 0.182. Extended downward pressure could bring horizontal support at USD 0.177 and subsequently USD 0.142 into view. The RSI for XLM lingers close to 62, while the MACD remains positive, signaling persistent buying interest in spite of the rejection near USD 0.234.
A Brief Roundup
While XRP and XLM hold their positions above vital long-term support levels, derivatives metrics signal rising caution. Meanwhile, Stellar’s throughput record of 217.4 TPS and USD 3.38 billion in tokenized assets underscore ongoing network growth as traders monitor critical support and resistance thresholds.